Difference between revisions of "Visualizing magnetic field lines"
(ad final picture, resize images) |
(fix some layout of code lines) |
||
| Line 5: | Line 5: | ||
* open the file in VisIt | * open the file in VisIt | ||
* create a new vector Expression (Control/Expressions...) | * create a new vector Expression (Control/Expressions...) | ||
| − | < | + | <pre> |
{<HYDROBASE--Bvec_lb_0_rb_>,<HYDROBASE--Bvec_lb_1_rb_>,<HYDROBASE--Bvec_lb_2_rb_>} | {<HYDROBASE--Bvec_lb_0_rb_>,<HYDROBASE--Bvec_lb_1_rb_>,<HYDROBASE--Bvec_lb_2_rb_>} | ||
| − | </ | + | </pre> |
that combines the three components into a single vector (the precise names of the scalars differ from version to version in VisIt). | that combines the three components into a single vector (the precise names of the scalars differ from version to version in VisIt). | ||
* add a "Streamline" plot and the "Project" operator | * add a "Streamline" plot and the "Project" operator | ||
Revision as of 15:17, 6 November 2019
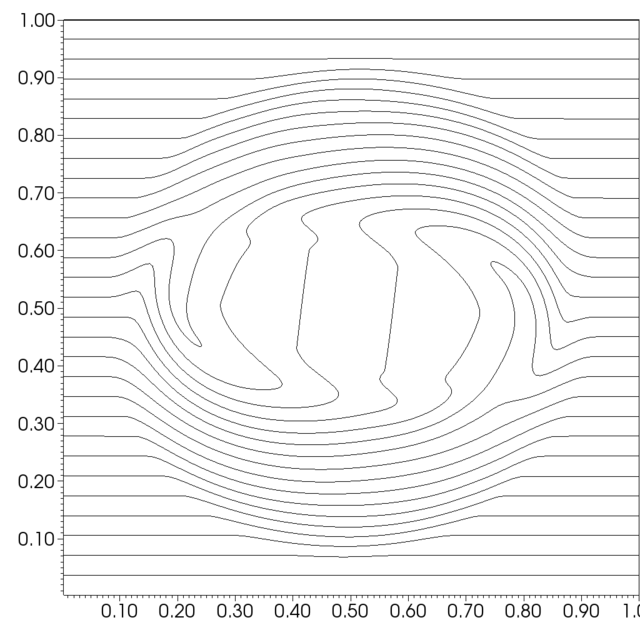
For the ET MHD paper, I wanted to visualize magnetic field lines as done in figure 4 of DelZannaa 2002. For this I wanted to use VisIt on 2d hdf5 output (unigrid) from Carpet. The data and paremter files can be found in the MHD paper repository [1].
To visualize them, one has to do the "usual VisIt" stuff to get a vector into VisIt. Ie.
- open the file in VisIt
- create a new vector Expression (Control/Expressions...)
{<HYDROBASE--Bvec_lb_0_rb_>,<HYDROBASE--Bvec_lb_1_rb_>,<HYDROBASE--Bvec_lb_2_rb_>}
that combines the three components into a single vector (the precise names of the scalars differ from version to version in VisIt).
- add a "Streamline" plot and the "Project" operator
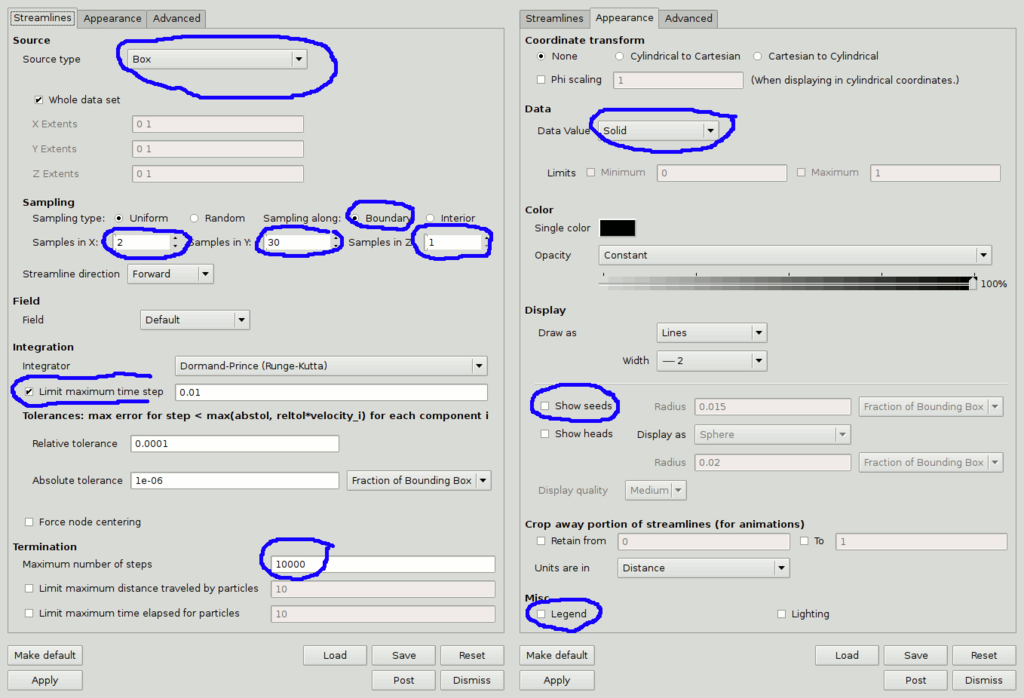
- set the streamline options as shown below
- you can find the full settings in the session file in the rotor repository [2]
- the final plot should look like this:

